Radix
- Role
- Senior Product Designer
- Scope
- Product strategy · Research · UX/UI · Design systems
- Product
- PropTech · B2B SaaS
Multifamily analytics
Making complex real-estate data easier to analyze and act on.
Radix is a multifamily analytics platform used by property teams, investors and analysts to understand markets, benchmark performance and evaluate investment opportunities.
I worked across the core analytics experience, customizable dashboards, the design system and ProForma — helping simplify complex workflows while building a more scalable product foundation.
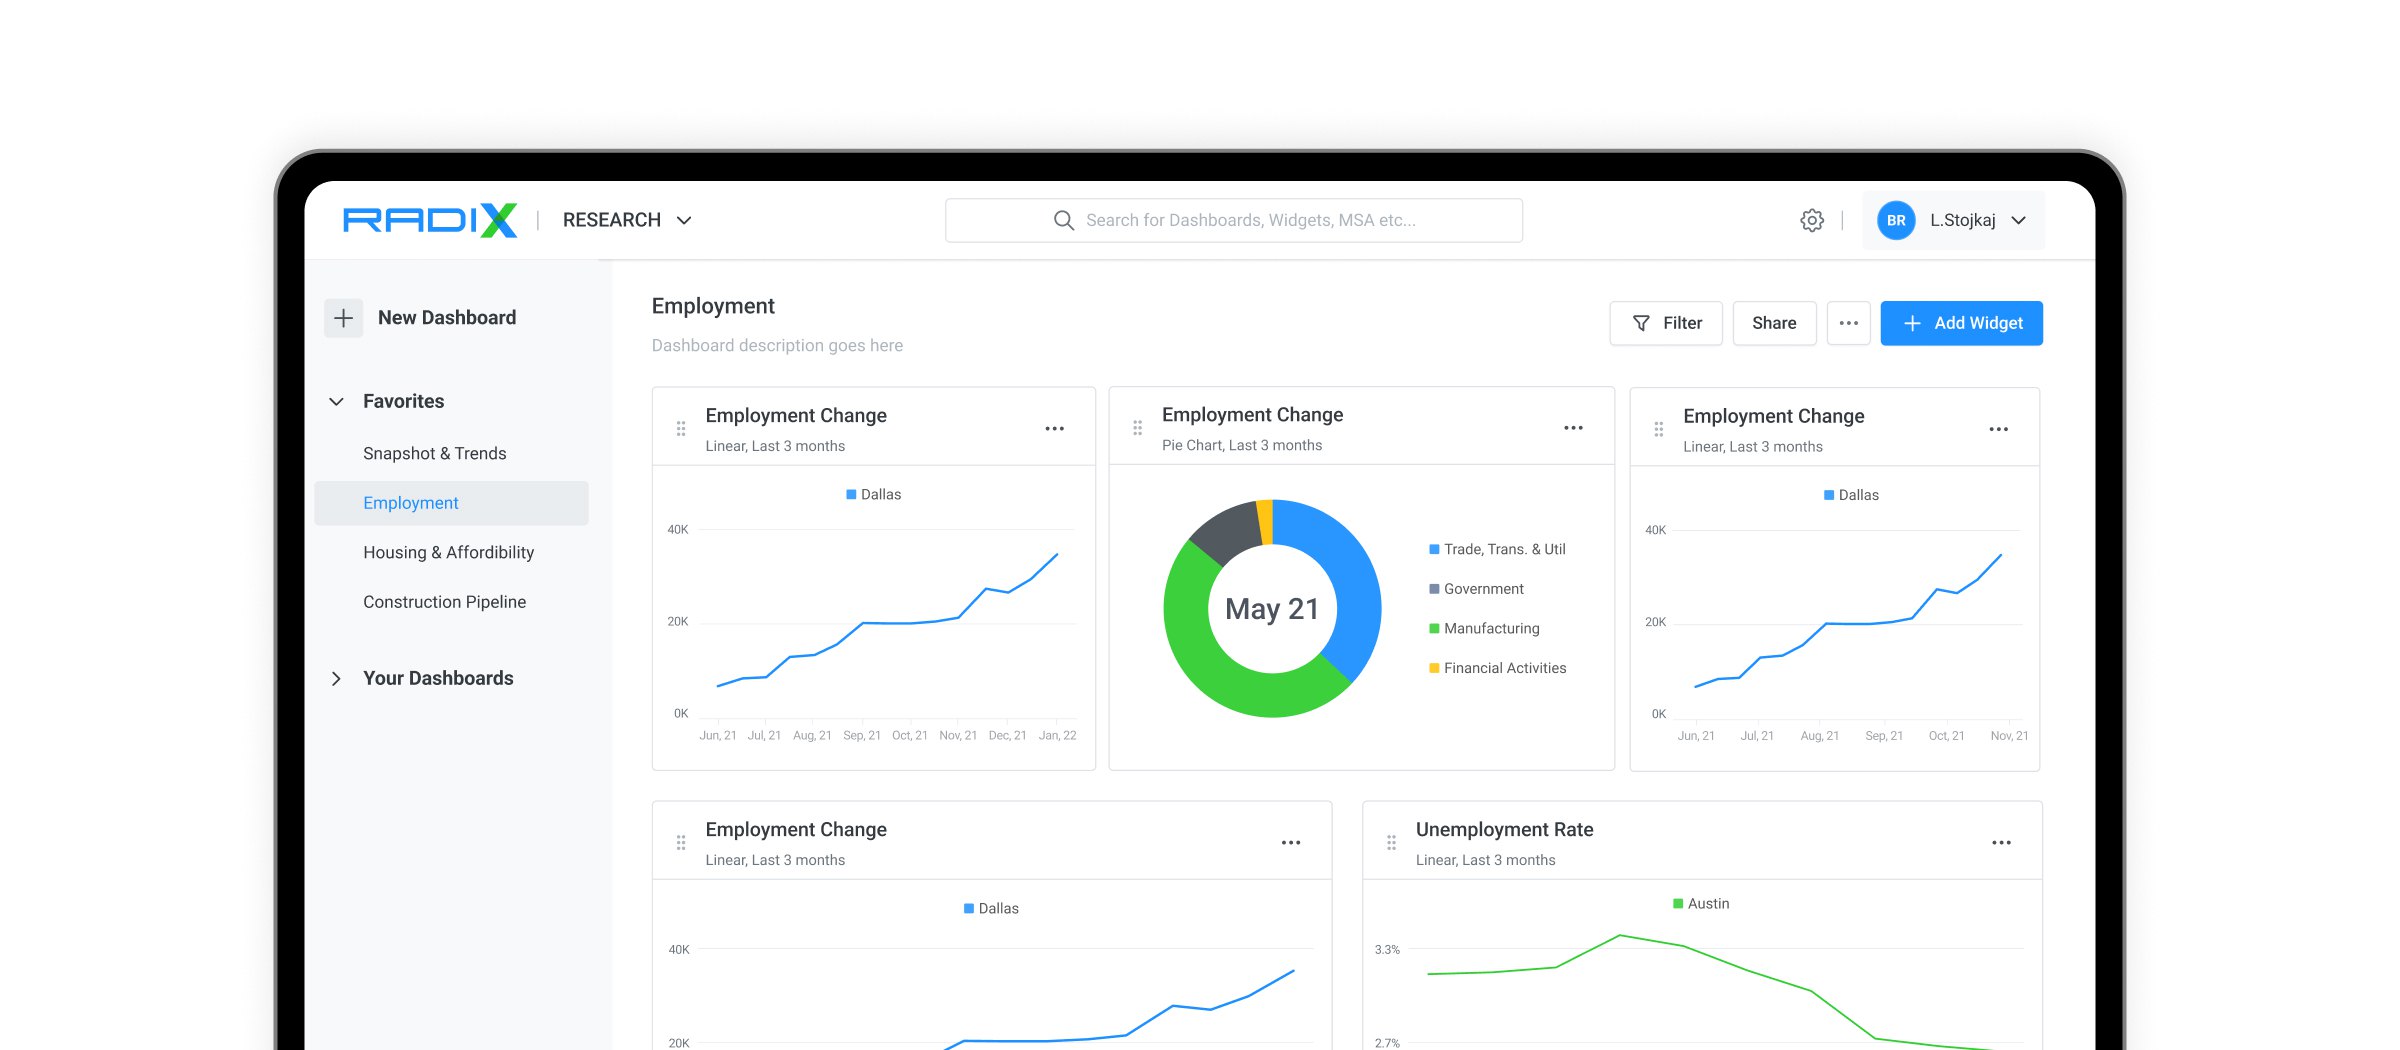
+65%Dashboard engagement within the first month
The Problem
Powerful data was difficult to navigate at scale.
Radix brought together large amounts of market, property and financial data, but analysts still needed to move between dense dashboards, modeling workflows and reporting tools to reach decisions.
01
Dense analytical workflows
Users needed to interpret large amounts of property and market data without losing context.
02
Limited dashboard flexibility
Different analysts needed different combinations of metrics, comparisons and views.
03
Inconsistent product patterns
As the platform expanded, interface patterns and components had evolved unevenly across the product.
Discovery & Research
Understanding how analysts actually worked
I worked with analysts, product managers and internal stakeholders to understand how users compared properties, benchmarked markets, built financial scenarios and prepared reports.
01
Analysis crossed multiple workflows
Property comparison, market benchmarking and financial modeling were interconnected rather than isolated tasks.
02
Different users needed different views
Analysts needed flexibility in how information was organized instead of relying on one fixed dashboard structure.
03
Speed mattered as much as depth
The platform needed to preserve analytical detail while reducing the effort required to reach and communicate an insight.
Design decision 01
Giving analysts control over their dashboards
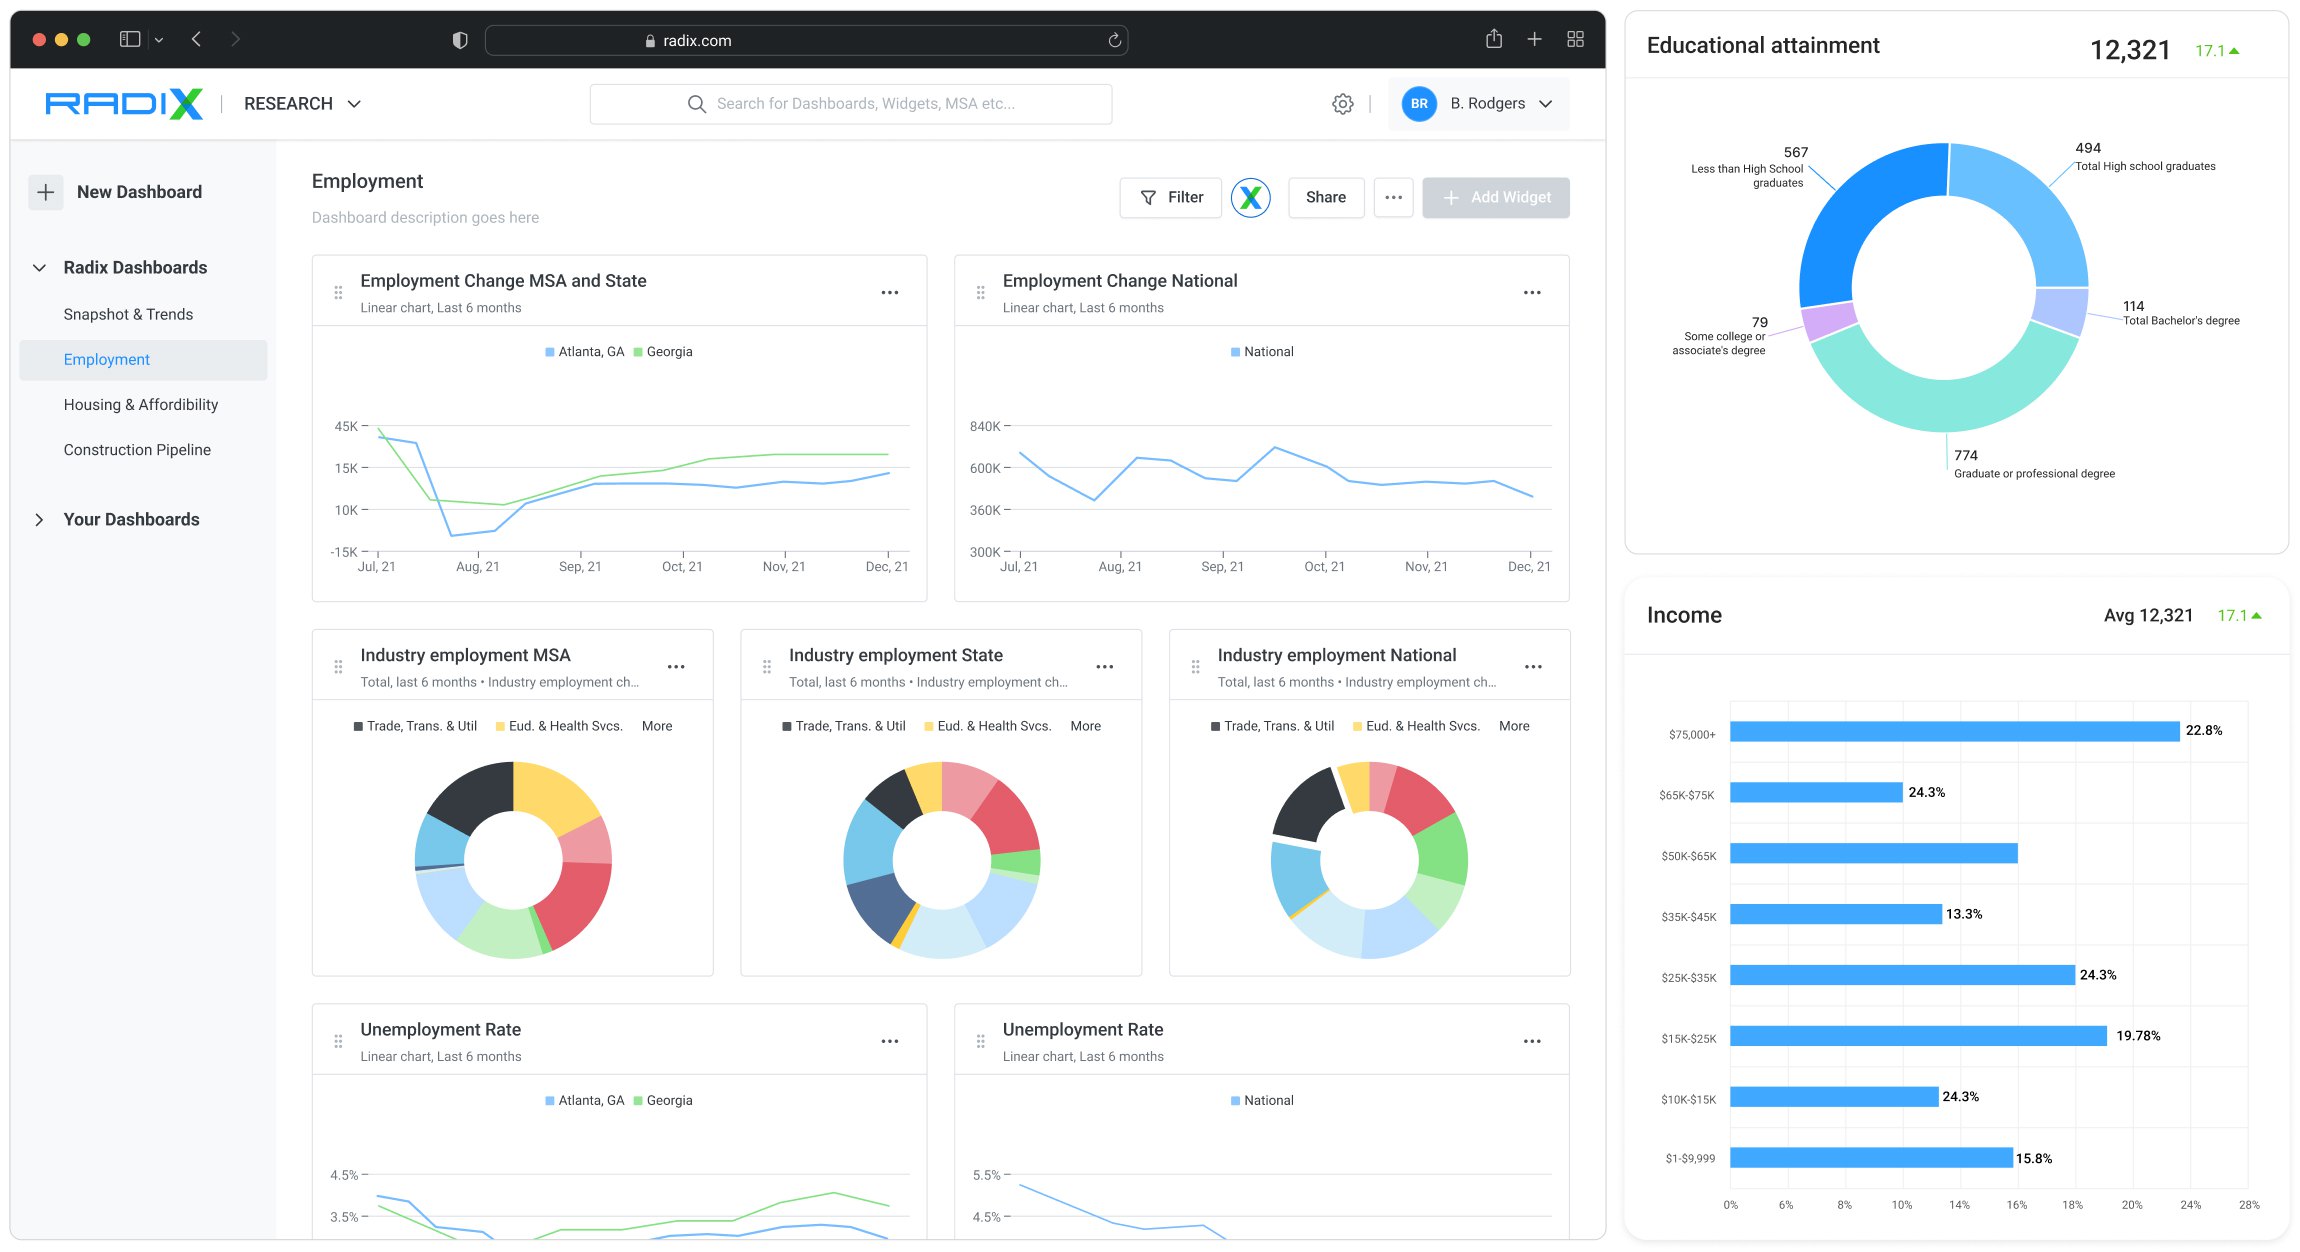
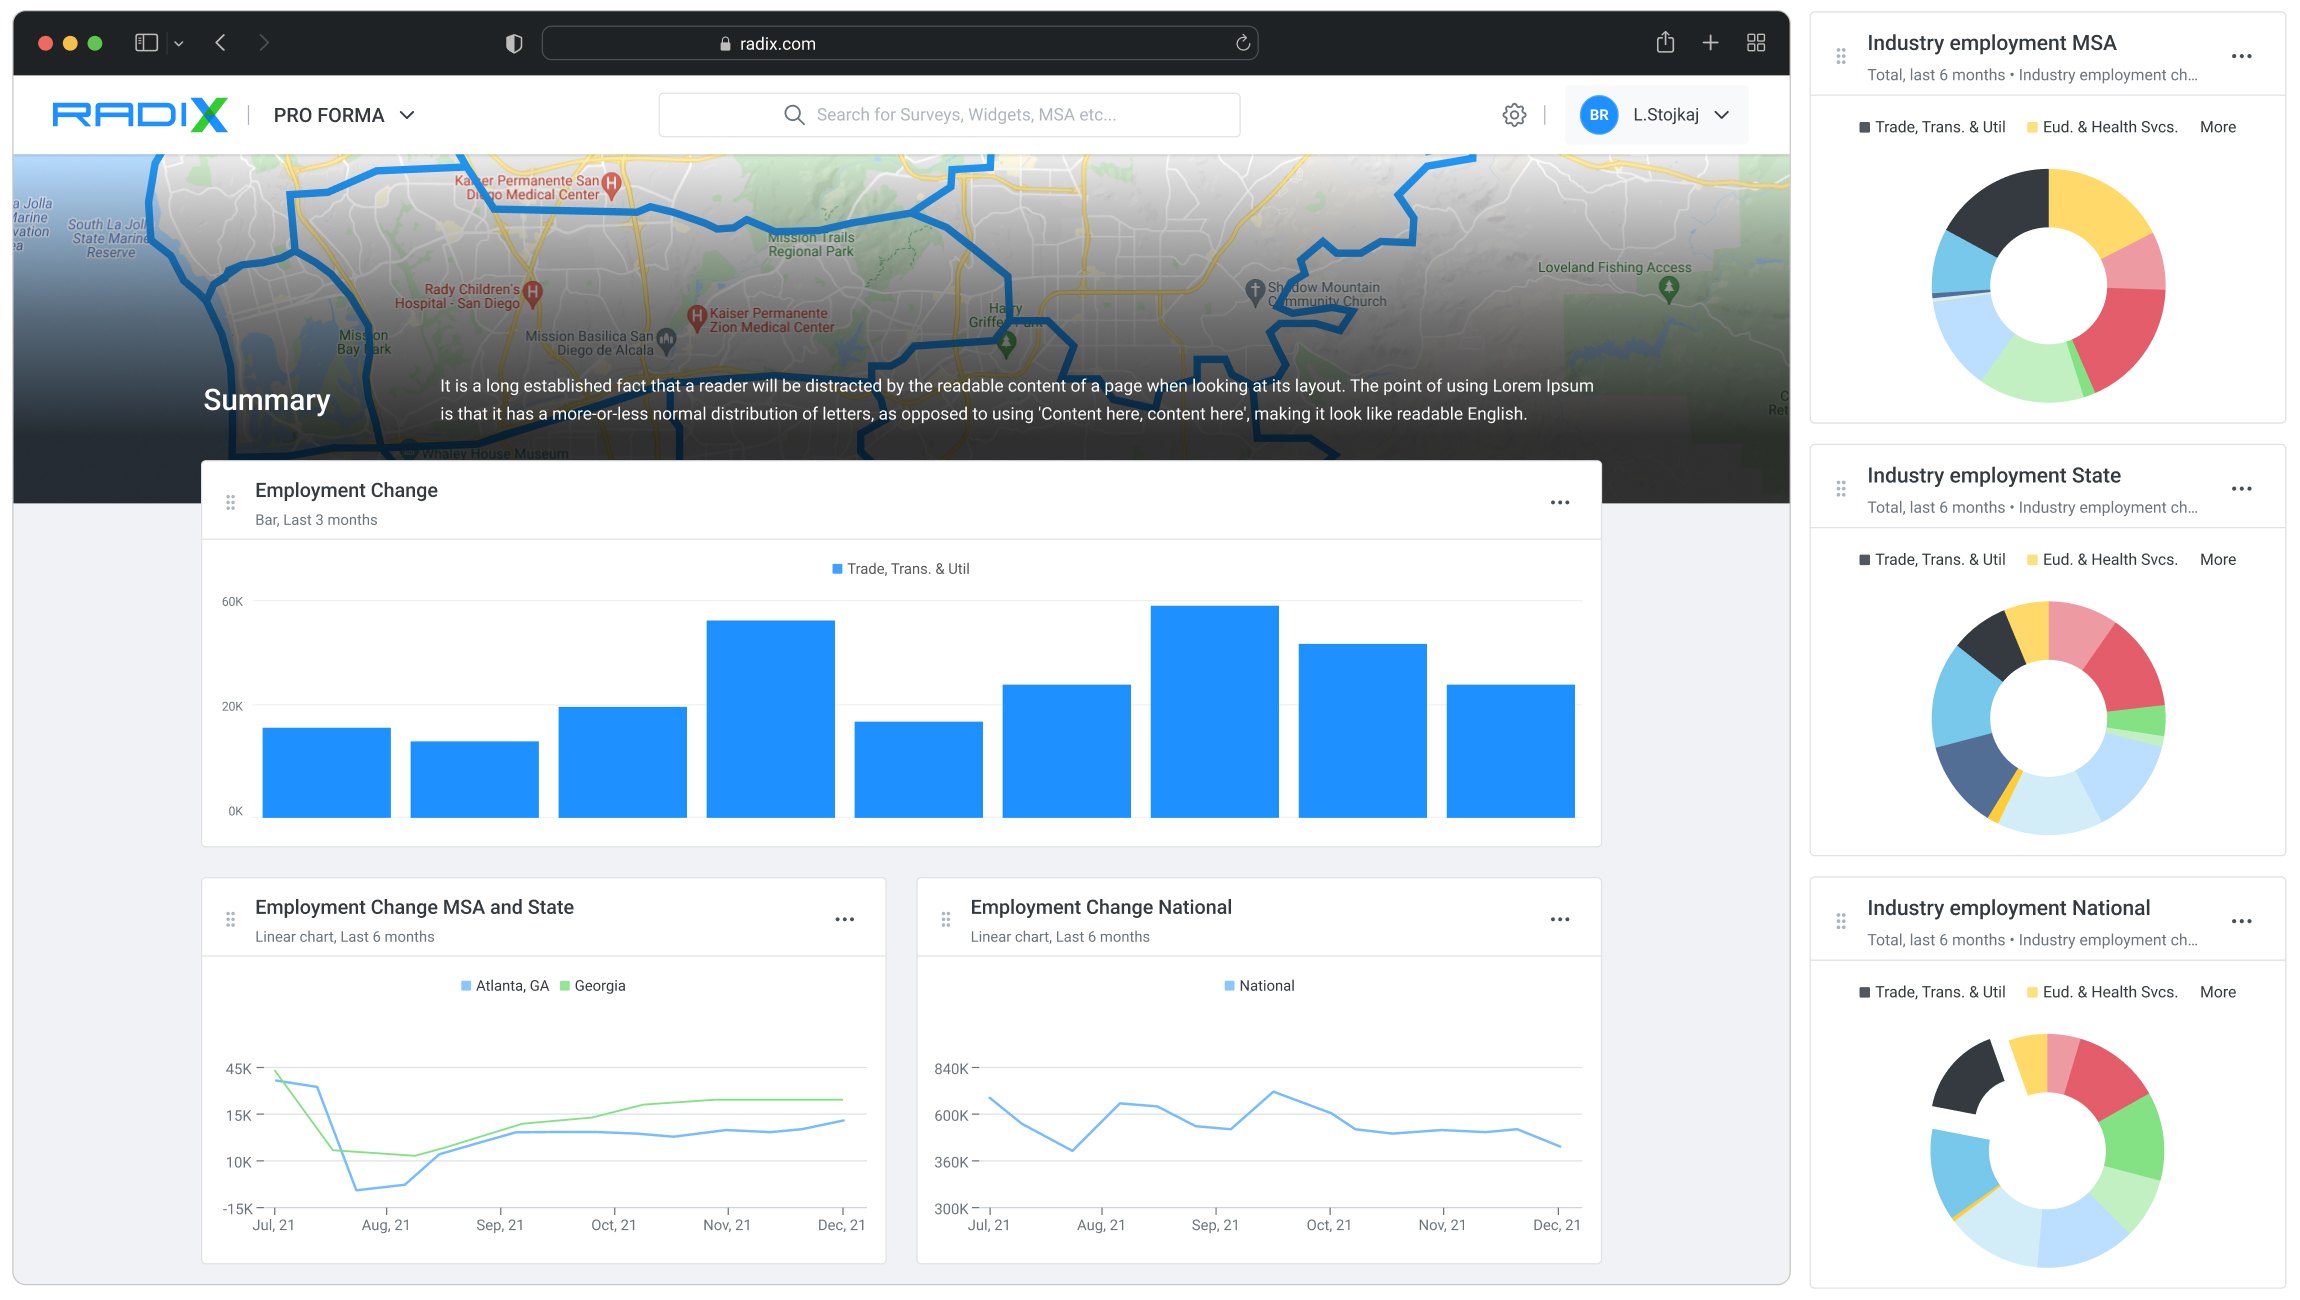
Rather than forcing every workflow into the same dashboard, the experience was redesigned around customizable views that allowed analysts to surface the metrics most relevant to their work.
The challenge was balancing flexibility with readability: users needed control over complex analytical content without turning the dashboard into an unstructured canvas.
01
Flexible composition
Allow dashboards to adapt to different analytical workflows.
02
Scannable visualization
Create clearer hierarchy across charts, metrics and comparisons.
03
Reusable widgets
Use consistent analytical components that could scale across dashboards.
Design decision 02
Building a system for a data-heavy product
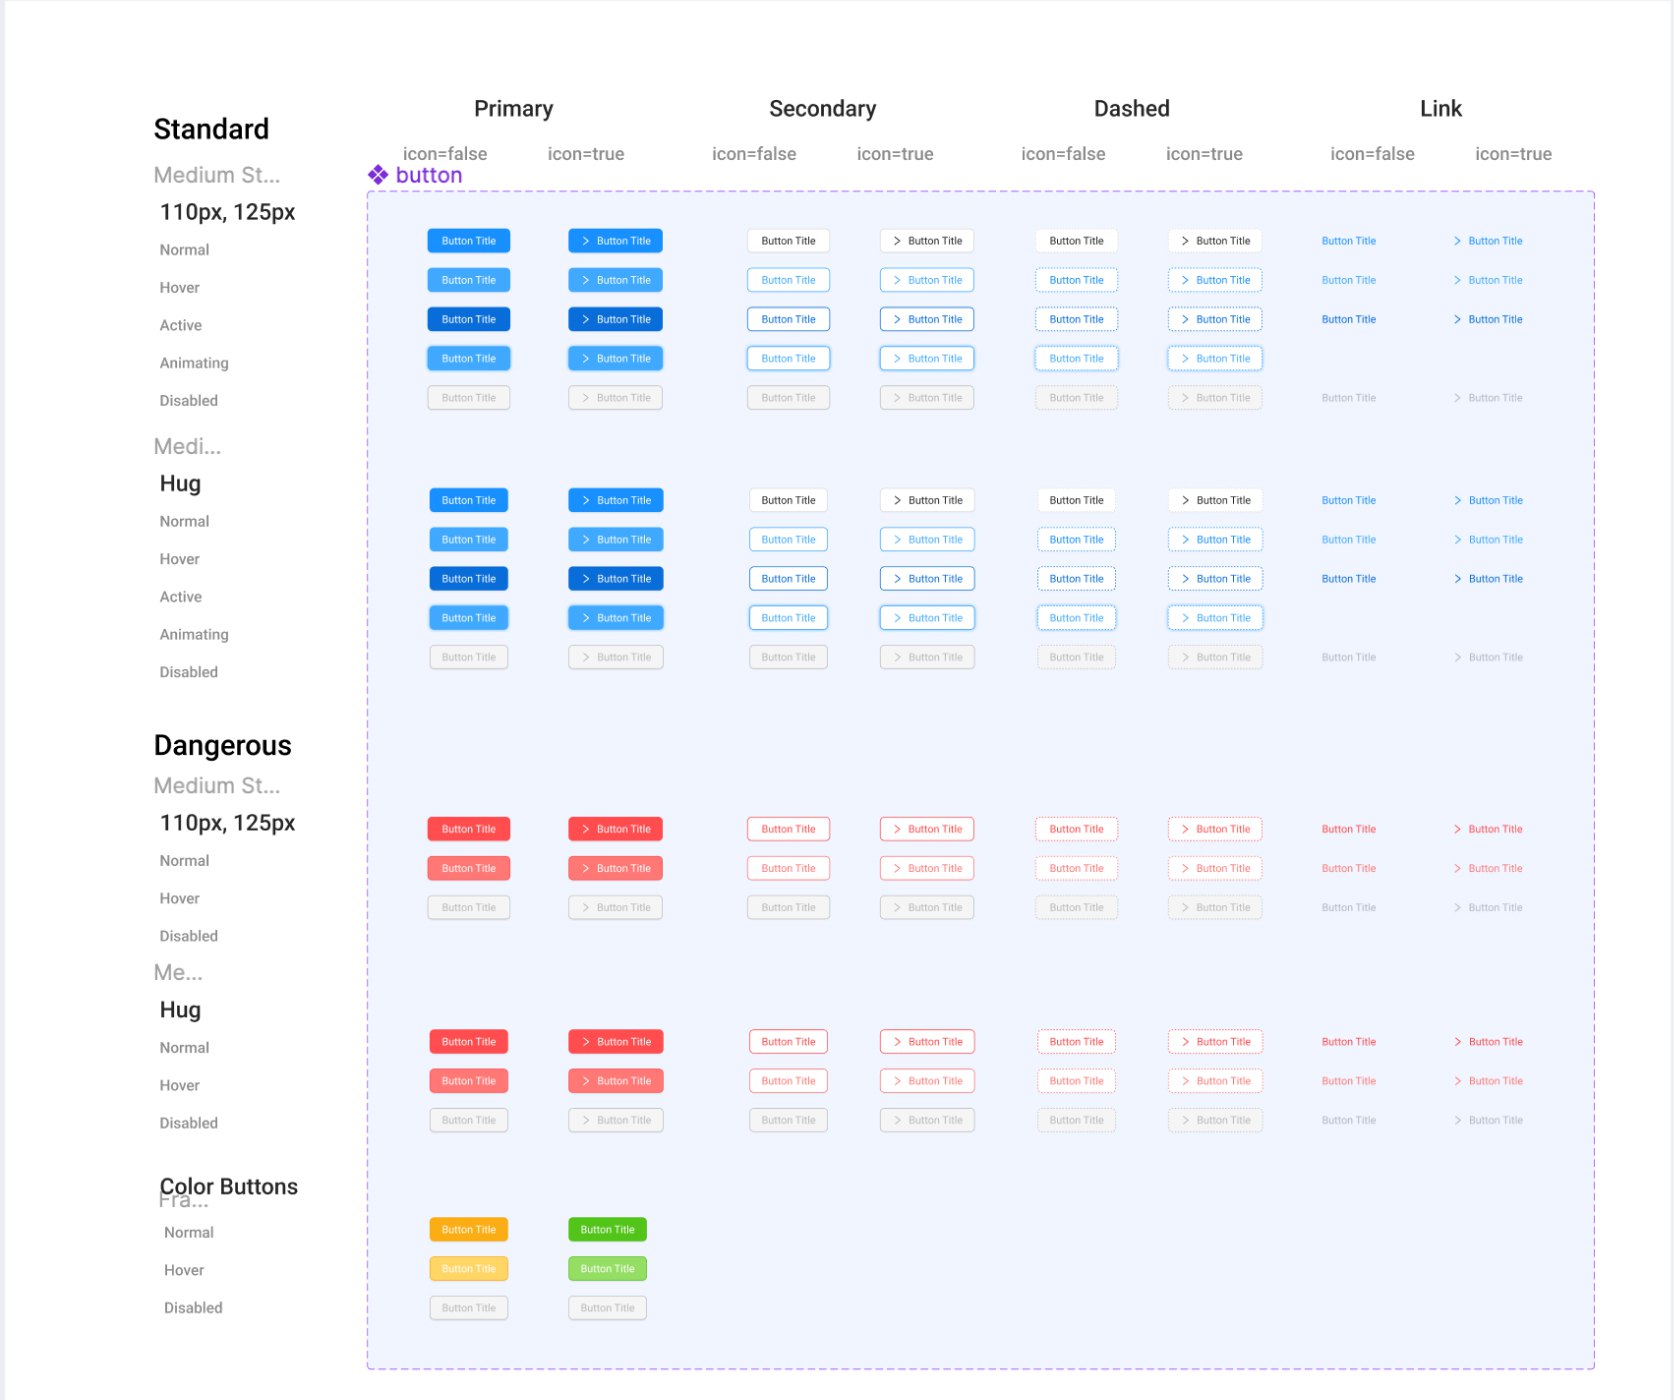
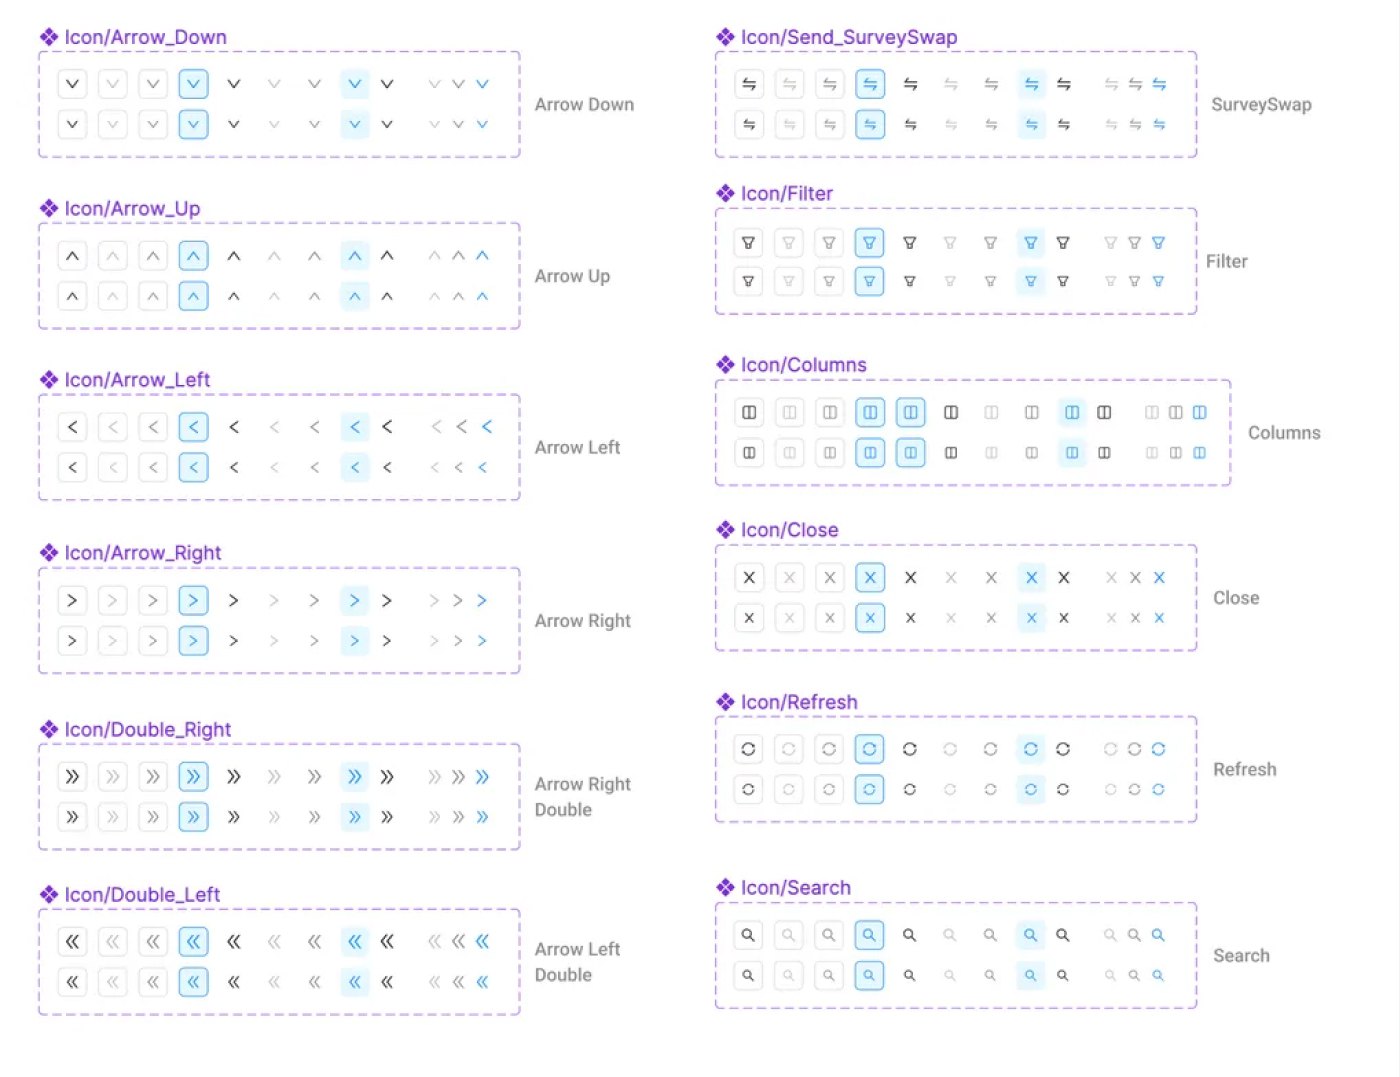
As Radix expanded, interface patterns had evolved inconsistently across dashboards and workflows. I led the redesign of the design system to create a more coherent foundation for both existing and future product work.
The system covered foundational styles and reusable components for analytics-heavy interfaces, including typography, color, controls, inputs, filters, tables, popovers, icons and data visualization patterns.
01
Consistent foundations
Standardize typography, color and interaction patterns.
02
Analytics-ready components
Build reusable patterns for filters, tables, inputs and data visualization.
03
Scalable implementation
Create components that could support both legacy and new product experiences.
Design decision 03
Turning an internal tool into a standalone investment product
Customer interviews revealed that analysts were exporting Radix data into spreadsheets to build investment models manually. That workaround exposed a gap between Radix’s analytics and the financial decisions users were making outside the product.
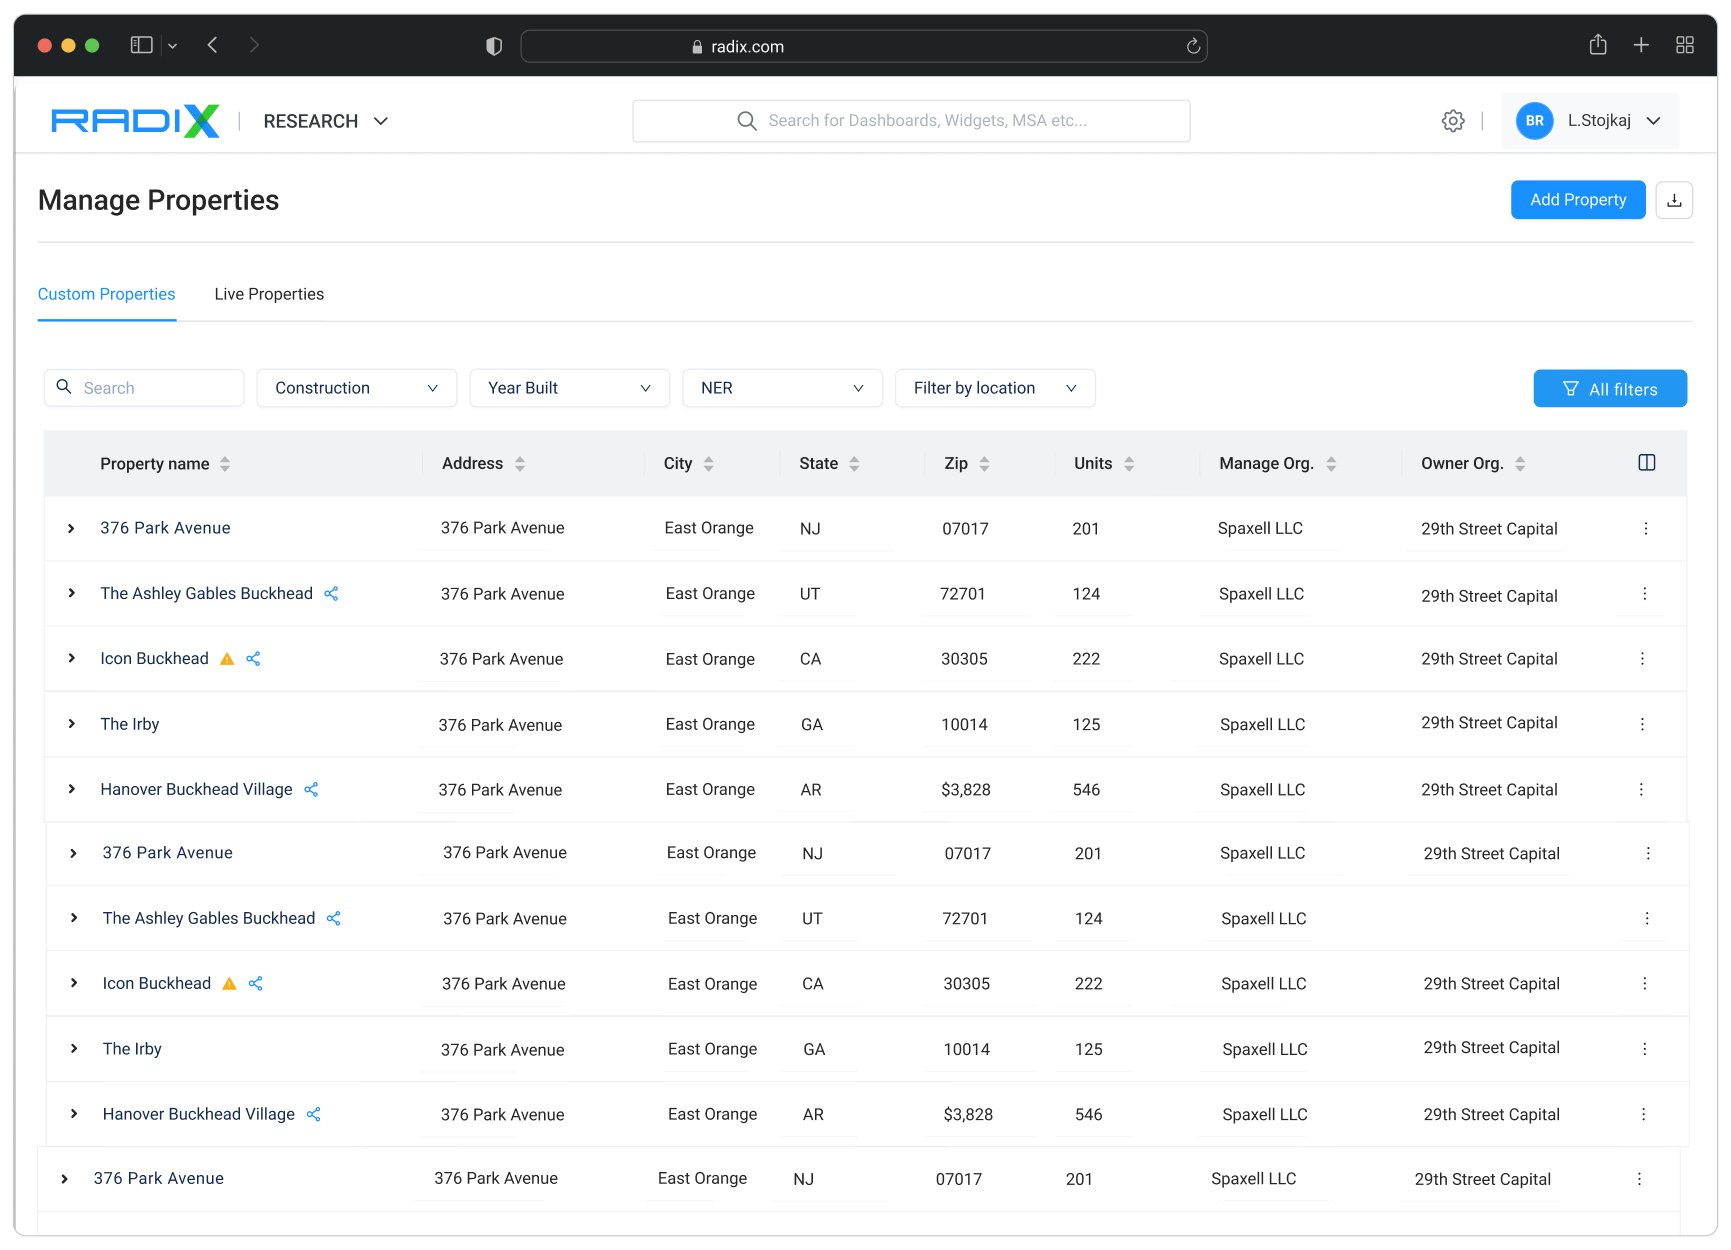
ProForma was designed to close that gap — bringing property setup, competitor analysis, market data, scenario modeling and reporting into one workflow, and helping position the capability as a standalone paid product.
01
Property & portfolio setup
Create and manage properties and organize the information needed for investment analysis.
02
Competitive analysis
Compare properties, competitors and market information within the same workflow.
03
Modeling & reporting
Explore financial scenarios and turn analysis into reports that could be shared or exported.
Outcome & Impact
The work helped Radix evolve both its core analytics experience and the product foundation underneath it.
Customizable dashboards gave analysts more control over how they worked with data, the redesigned design system created reusable patterns across the platform, and ProForma expanded from an internal capability into a standalone product offering.
+65%Dashboard engagement within the first month